Monthly Average Rainy days in Kniveton
The number of days each month with rain, snow and hail in Kniveton (Derbyshire), the United Kingdom.
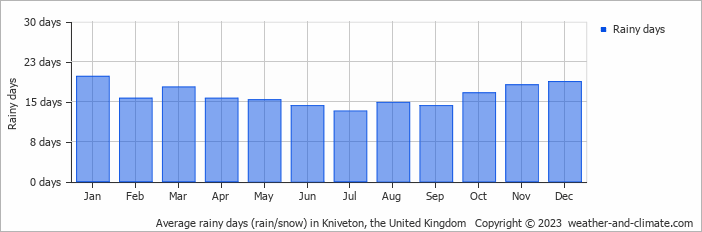
- Most rainy days are in January, February, March, April, May, October, November and December.
- On average, January is the most rainy with 19 days of rain/snow.
- On average, July is the driest month with 13 rainy days.
- The average annual number of rainy days is 193.
Current rainfall in Kniveton
Wed Dec 04
10°C | 3°C
S  18 km/h
18 km/h7.9 mm
broken clouds and rain
Thu Dec 05
11°C | 6°C
SW 36 km/h
36 km/h22 mm
overcast and heavy rain
Fri Dec 06
7°C | 3°C
NW 25 km/h
25 km/h18 mm
broken clouds and rain


