ClimateForecastMayJune >>

Average monthly rainy days in Klong Wan

The number of days each month with rain, snow and hail in Klong Wan (Prachuap Khiri Khan Province), Thailand.

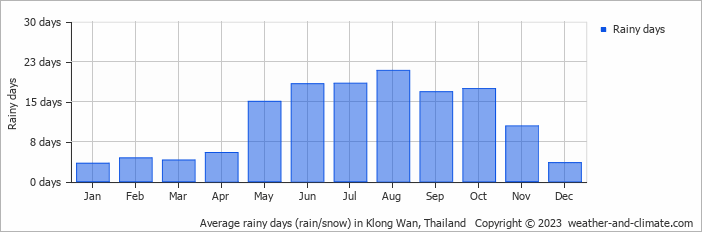
  • Most rainy days are in May, June, July, August, September and October.
  • On average, August is the most rainy with 20 days of rain/snow.
  • On average, January is the driest month with 3 rainy days.
  • The average annual number of rainy days is 137.

Forecast for Klong Wan

Thu   May 16
36°C | 26°C
SE 18 km/h
5.8 mm
broken clouds and thunder

broken clouds and thunder

Fri   May 17
34°C | 26°C
SE 11 km/h
13 mm
broken clouds and thunder

broken clouds and thunder

Sat   May 18
36°C | 26°C
SE 14 km/h
6.4 mm
broken clouds and thunder

broken clouds and thunder

Interested in more climate information?

This site provides you with all the information you need about the climate in Klong Wan.

Our site offers climate and forecast data for every country in the world. Are you going to Thailand? On this website you can find historical weather averages for many cities in Thailand. Not sure yet where to go? We now have a tool which recommends destinations that suit your ideal climate conditions. Find out where to go with our weather planner.