ClimateForecastMayJune >>

Average monthly rainy days in Klapmuts

The number of days each month with rain, snow and hail in Klapmuts (Western Cape), South Africa.

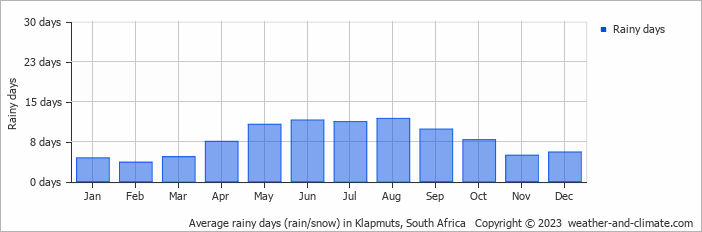
  • On average, August is the most rainy with 11 days of rain/snow.
  • On average, February is the driest month with 3 rainy days.
  • The average annual number of rainy days is 93.

Forecast for Klapmuts

Mon   May 06
23°C | 13°C
N 22 km/h
broken clouds and no rain

broken clouds and no rain

Tue   May 07
17°C | 14°C
W 11 km/h
8.4 mm
overcast and heavy rain

overcast and heavy rain

Wed   May 08
22°C | 10°C
SW 14 km/h
almost clear and no rain

almost clear and no rain

Interested in more climate information?

This site provides you with all the information you need about the climate in Klapmuts.

Our site offers climate and forecast data for every country in the world. Are you going to South Africa? On this website you can find historical weather averages for many cities in South Africa. Not sure yet where to go? We now have a tool which recommends destinations that suit your ideal climate conditions. Find out where to go with our weather planner.