ClimateForecastAprilMay >>

Average monthly rainy days in Kinneret

The number of days each month with rain, snow and hail in Kinneret (North District Israel), Israel.

Average monthly rainy days in Kinneret,

Feel free to add this climate graph to your website. Click the copy button above.

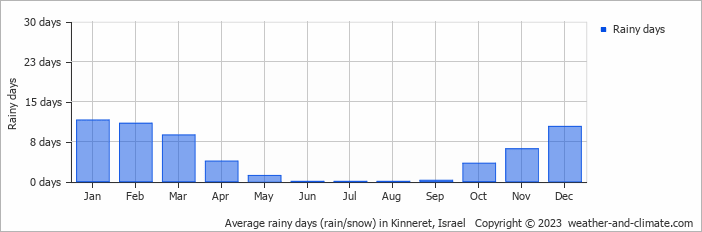
  • Kinneret has dry periods in May, June, July, August and September.
  • On average, January is the most rainy with 11 days of rain/snow.
  • On average, August is the driest month with 0 rainy days.
  • The average annual number of rainy days is 56.

Weather Forecasts for Kinneret

Sat   Apr 20
26°C | 14°C
W 14 km/h
partly cloudy and no rain

partly cloudy and no rain

Sun   Apr 21
23°C | 14°C
W 18 km/h
almost clear and no rain

almost clear and no rain

Mon   Apr 22
25°C | 14°C
W 11 km/h
clear and no rain

clear and no rain

Interested in more climate information?

Weather and Climate provides you with all the information you need about the climate in Kinneret.

Our site offers climate and forecast data for every country in the world. Are you going to Israel? On this website you can find historical weather averages for many cities in Israel. Not sure yet where to go? We now have a tool which recommends destinations that suit your ideal climate conditions. Find out where to go with our weather planner.