Average Rainy - Precipitation days in Kata Beach
Kata Beach sees 172 days of precipitation annually, totaling to 2131 mm of rain. Learn more about it on this page.
Monthly Distribution of Rainy Days
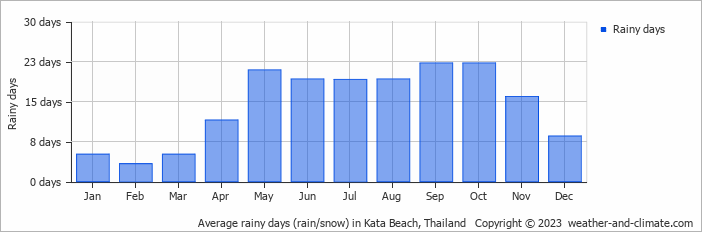
Precipitation peaks in October with 303 mm falling over 22 rainy days. The driest period is February, receiving 32 mm across 3 rainy days.
Amsterdam Precipitation Days Compared World Wide
Kata Beach's average annual precipitation falls over 172 days. Let's compare this to some popular worldwide tourist destinations:
In Cairo, Egypt, there are only about 16 precipitation days annually, making it one of the driest capitals in the world.
In Bogotá, Colombia, there are around 188 precipitation days annually, typical for its high-altitude tropical climate.
In Barcelona, Spain, there are approximately 121 precipitation days per year, evenly distributed across the year with no extreme wet or dry seasons.
Every year, the city of New York, USA, records about 130 precipitation days, with rainfall evenly distributed throughout the year.
In Seoul, South Korea, the city experiences 106 precipitation days annually, with most rain falling during the summer monsoon season.
Perth, Australia, sees approximately 103 precipitation days annually, mostly during the winter months.
Fun facts about Rain from Around the World
Let’s explore more fascinating precipitation records:
- Tutunendo, Colombia, gets about 340 days of rain every year, which arguably makes it the wettest place in the world.
- On Réunion Island, a tropical cyclone generated 1825 mm in just 24 hours.
- Singapore receives thunder on 167 days in the year and is considered one of the most thunderous cities in the world.
- The smallest drops that fall are called drizzle drops, and they have a diameter of 0.5 mm.
- Some heavy storms generate "diamond dust," which consists of very small ice crystals that float in the air.
For more detailed information about rainfall patterns in Kata Beach, visit our Rainfall & Precipitation page.
Current rainfall in Kata Beach


