Average Rainy - Precipitation days in Kampung Padang Masirat
Kampung Padang Masirat sees 171 days of precipitation annually, totaling to 2192 mm of rain. Learn more about it on this page.
Monthly Distribution of Rainy Days
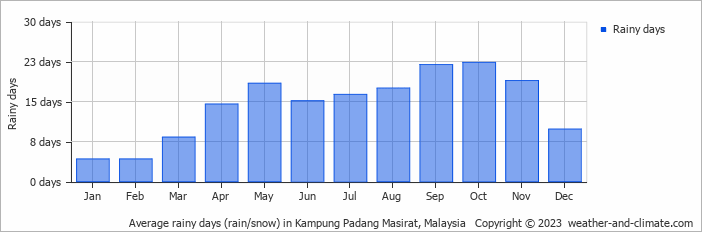
The wettest month is October, with 22 rainy days bringing 315 mm of rain. In contrast, January sees 4 rainy days with 48 mm of rain.
Amsterdam Precipitation Days Compared World Wide
On average, Kampung Padang Masirat receives over 171 days of precipitation annually. For comparison, here is some data from popular tourist destinations around the world:Las Vegas, USA, gets about 26 precipitation days annually, which is typical for its arid desert climate.
Singapore, Singapore, records about 175 precipitation days per year, with rain spread fairly evenly throughout the year.
The city of Rome, Italy, averages 131 precipitation days annually, spread fairly evenly throughout the year.
Boston, USA, experiences 134 precipitation days annually, including significant snow during winter.
Beijing, China, averages 72 precipitation days annually, concentrated in the summer months.
Perth, Australia, sees approximately 103 precipitation days annually, mostly during the winter months.
Rain Facts From Around the Globe
Here are some amazing facts about rain and precipitation worldwide:
- Cherrapunji, India, records an average of 322 rainy days each year. Despite this, the wettest place is Mount Waialeale in Hawaii with 11500 mm annual rainfall.
- The fastest recorded raindrop fell at 18 meters per second during a thunderstorm in Brazil.
- The Atacama Desert in Chile is so dry that some weather stations have never recorded rainfall since their installation.
- The largest recorded raindrop measured 8.8 mm in diameter during a tropical storm on La Réunion Island.
- Some clouds can weigh up to 500,000 tons, that's equivalent to the weight of 100 elephants.
For more detailed information about rainfall patterns in Kampung Padang Masirat, visit our Rainfall & Precipitation page.
Current rainfall in Kampung Padang Masirat