Average Rainy - Precipitation days in Kamala Beach
With 175 days and 2195 mm of annual rain, Kamala Beach has a moderate precipitation pattern. On this page, you can learn everything about the number of precipitation days.
Monthly Distribution of Rainy Days
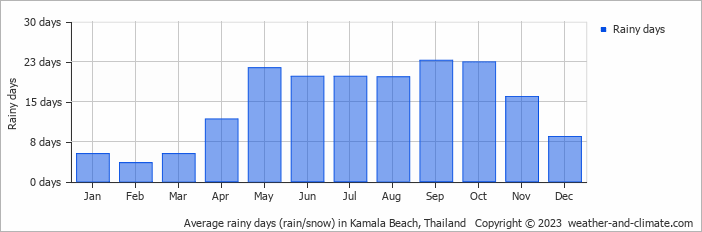
The wettest month is October, with 22 rainy days bringing 308 mm of rain. In contrast, February sees 4 rainy days with 31 mm of rain.
Amsterdam Precipitation Days Compared World Wide
Kamala Beach's average annual precipitation falls over 175 days. Let's compare this to some popular worldwide tourist destinations:
In Riyadh, Saudi Arabia, there are about 29 precipitation days annually, reflecting its dry desert environment.
Singapore, Singapore, records about 175 precipitation days per year, with rain spread fairly evenly throughout the year.
In Barcelona, Spain, there are approximately 121 precipitation days per year, evenly distributed across the year with no extreme wet or dry seasons.
In Toronto, Canada, there are about 126 precipitation days per year, with snowfall occurring in winter and rainfall in summer.
Beijing, China, averages 72 precipitation days annually, concentrated in the summer months.
In Tokyo, Japan, the city sees around 181 precipitation days annually, with significant summer rains due to typhoon season.
Rain Facts From Around the Globe
Let’s explore more fascinating precipitation records:
- Tutunendo, Colombia, gets about 340 days of rain every year, which arguably makes it the wettest place in the world.
- On Réunion Island, a tropical cyclone generated 1825 mm in just 24 hours.
- Singapore receives thunder on 167 days in the year and is considered one of the most thunderous cities in the world.
- The smallest drops that fall are called drizzle drops, and they have a diameter of 0.5 mm.
- Some heavy storms generate "diamond dust," which consists of very small ice crystals that float in the air.
For more detailed information about rainfall patterns in Kamala Beach, visit our Rainfall & Precipitation page.
Current rainfall in Kamala Beach


