Monthly Average Rainy days in Jinghong
The number of days each month with rain, snow and hail in Jinghong (Yunnan), China.
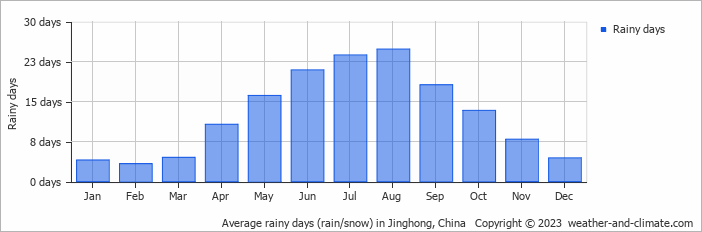
- Most rainy days are in May, June, July, August and September.
- On average, August is the most rainy with 24 days of rain/snow.
- On average, February is the driest month with 3 rainy days.
- The average annual number of rainy days is 151.
Current rainfall in Jinghong
Sun Dec 22
24°C | 16°C
SE  2 m/s
2 m/s
2 m/s0.8 mm
broken clouds and chance of rain
Mon Dec 23
26°C | 16°C
SW 1 m/s
1 m/sbroken clouds and no rain
Tue Dec 24
26°C | 14°C
SE 1 m/s
1 m/spartly cloudy and no rain


