Average Rainy - Precipitation days in Jimbaran
Over the course of the year, Jimbaran experiences 1622 mm of rain across 106 days. On this page you will discover more about the number of precipitation days.
Monthly Distribution of Rainy Days
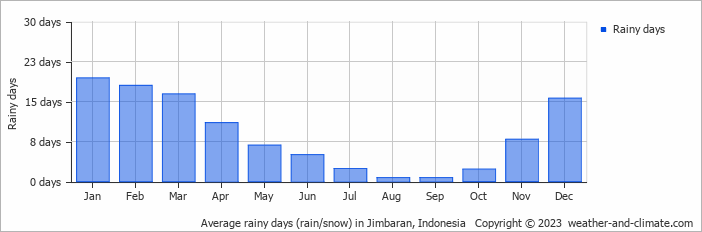
Precipitation peaks in January with 285 mm falling over 19 rainy days. The driest period is August, receiving 39 mm across a single rainy day.
Amsterdam Precipitation Days Compared World Wide
On average, Jimbaran receives over 106 days of precipitation annually. For comparison, here is some data from popular tourist destinations around the world:In Riyadh, Saudi Arabia, there are about 29 precipitation days annually, reflecting its dry desert environment.
In Kuala Lumpur, Malaysia, the city experiences around 212 precipitation days annually, consistent with its tropical rainforest climate.
In Athens, Greece, it rains around 70 days in the year; therefore, it is one of the driest Mediterranean cities, mainly dominated by winter rainfall.
Boston, USA, experiences 134 precipitation days annually, including significant snow during winter.
In Seoul, South Korea, the city experiences 106 precipitation days annually, with most rain falling during the summer monsoon season.
In Tokyo, Japan, the city sees around 181 precipitation days annually, with significant summer rains due to typhoon season.
Rain Facts From Around the Globe
Here are some amazing facts about rain and precipitation worldwide:
- Cherrapunji, India, records an average of 322 rainy days each year. Despite this, the wettest place is Mount Waialeale in Hawaii with 11500 mm annual rainfall.
- The fastest recorded raindrop fell at 18 meters per second during a thunderstorm in Brazil.
- The Atacama Desert in Chile is so dry that some weather stations have never recorded rainfall since their installation.
- The largest recorded raindrop measured 8.8 mm in diameter during a tropical storm on La Réunion Island.
- Some clouds can weigh up to 500,000 tons, that's equivalent to the weight of 100 elephants.
For more detailed information about rainfall patterns in Jimbaran, visit our Rainfall & Precipitation page.
Current rainfall in Jimbaran


