Monthly Average Rainy days in Holwick
The number of days each month with rain, snow and hail in Holwick (Durham), the United Kingdom.
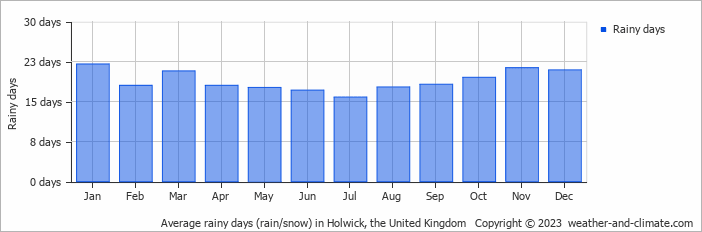
- Most rainy days are in January, February, March, April, May, June, July, August, September, October, November and December.
- On average, January is the most rainy with 22 days of rain/snow.
- On average, July is the driest month with 15 rainy days.
- The average annual number of rainy days is 226.
Current rainfall in Holwick
Thu Jan 16
8°C | 2°C
SW  6 m/s
6 m/s
6 m/salmost clear and no rain
Fri Jan 17
6°C | 3°C
SW 8 m/s
8 m/sovercast and no rain
Sat Jan 18
4°C | 1°C
SW 5 m/s
5 m/sbroken clouds and no rain


