ClimateForecastMayJune >>

Average monthly rainy days in Hillingdon

The number of days each month with rain, snow and hail in Hillingdon (Greater London), the United Kingdom.

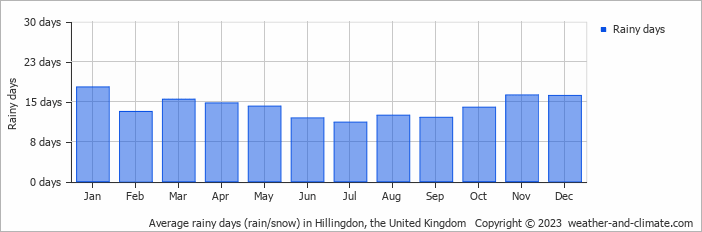
  • Most rainy days are in January, March, November and December.
  • On average, January is the most rainy with 17 days of rain/snow.
  • On average, July is the driest month with 11 rainy days.
  • The average annual number of rainy days is 168.

Forecast for Hillingdon

Sat   May 18
20°C | 12°C
NE 11 km/h
0.6 mm
broken clouds and slight rain

broken clouds and slight rain

Sun   May 19
22°C | 10°C
NE 18 km/h
0.5 mm
partly cloudy and  chance of slight rain

partly cloudy and chance of slight rain

Mon   May 20
21°C | 9°C
NE 18 km/h
partly cloudy and no rain

partly cloudy and no rain

Interested in more climate information?

This site provides you with all the information you need about the climate in Hillingdon.

Our site offers climate and forecast data for every country in the world. Are you going to the United Kingdom? On this website you can find historical weather averages for many cities in the United Kingdom. Not sure yet where to go? We now have a tool which recommends destinations that suit your ideal climate conditions. Find out where to go with our weather planner.