Monthly Average Rainy days in Herradura
The number of days each month with rain, snow and hail in Herradura (), Costa Rica.
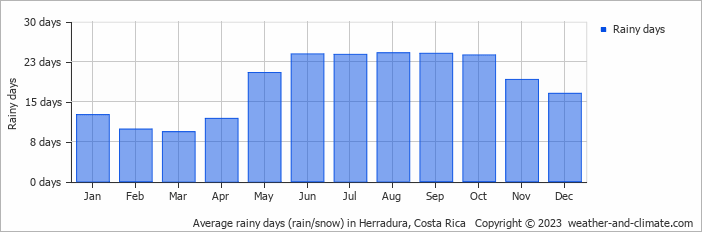
- Most rainy days are in May, June, July, August, September, October, November and December.
- On average, August is the most rainy with 24 days of rain/snow.
- On average, March is the driest month with 9 rainy days.
- The average annual number of rainy days is 219.
Current rainfall in Herradura
Tue Nov 26
20°C | 13°C
SW  4 km/h
4 km/hovercast and no rain
Wed Nov 27
18°C | 14°C
SW 7 km/h
7 km/h24 mm
overcast and thunder
Thu Nov 28
18°C | 13°C
SW 7 km/h
7 km/h11 mm
overcast and heavy rain