Monthly Average Rainy days in Hatlestrand
The number of days each month with rain, snow and hail in Hatlestrand (Hordaland), Norway.
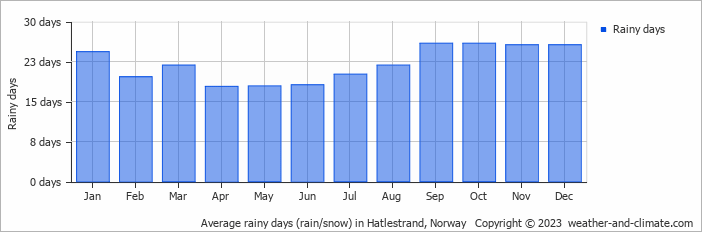
- Most rainy days are in January, February, March, April, May, June, July, August, September, October, November and December.
- On average, October is the most rainy with 25 days of rain/snow.
- On average, April is the driest month with 17 rainy days.
- The average annual number of rainy days is 264.
Current rainfall in Hatlestrand
Sat Jan 11
2°C | -2°C
NE  1 m/s
1 m/s
1 m/sclear and no rain
Sun Jan 12
3°C | -3°C
SE 2 m/s
2 m/sbroken clouds and no rain
Mon Jan 13
7°C | 3°C
S 7 m/s
7 m/s38 mm
overcast and heavy rain