ClimateForecastMayJune >>

Average monthly rainy days in Greyton

The number of days each month with rain, snow and hail in Greyton (Western Cape), South Africa.

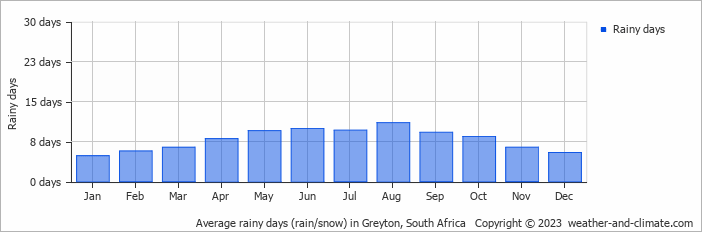
  • On average, August is the most rainy with 11 days of rain/snow.
  • On average, January is the driest month with 4 rainy days.
  • The average annual number of rainy days is 94.

Weather Forecasts for Greyton

Thu   May 02
30°C | 9°C
NW 14 km/h
clear and no rain

clear and no rain

Fri   May 03
30°C | 12°C
SW 7 km/h
almost clear and no rain

almost clear and no rain

Sat   May 04
21°C | 11°C
W 11 km/h
almost clear and no rain

almost clear and no rain

Interested in more climate information?

Weather and Climate provides you with all the information you need about the climate in Greyton.

Our site offers climate and forecast data for every country in the world. Are you going to South Africa? On this website you can find historical weather averages for many cities in South Africa. Not sure yet where to go? We now have a tool which recommends destinations that suit your ideal climate conditions. Find out where to go with our weather planner.