ClimateForecastMayJune >>

Average monthly rainy days in Grayling (MI)

The number of days each month with rain, snow and hail in Grayling (Michigan), the United States of America.

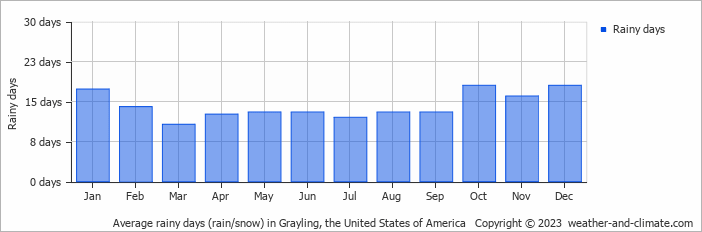
  • Most rainy days are in January, October, November and December.
  • On average, October is the most rainy with 18 days of rain/snow.
  • On average, March is the driest month with 10 rainy days.
  • The average annual number of rainy days is 170.

Forecast for Grayling (MI)

Mon   May 20
27°C | 10°C
SW 14 km/h
17 mm
partly cloudy and small chance of rain

partly cloudy and small chance of rain

Tue   May 21
26°C | 13°C
SW 11 km/h
8.1 mm
broken clouds and  chance of slight rain

broken clouds and chance of slight rain

Wed   May 22
23°C | 13°C
SW 22 km/h
almost clear and no rain

almost clear and no rain

Interested in more climate information?

This site provides you with all the information you need about the climate in Grayling.

Our site offers climate and forecast data for every country in the world. Are you going to the United States of America? On this website you can find historical weather averages for many cities in the United States of America. Not sure yet where to go? We now have a tool which recommends destinations that suit your ideal climate conditions. Find out where to go with our weather planner.