Monthly Average Rainy days in Glin
The number of days each month with rain, snow and hail in Glin (Limerick County), Ireland.
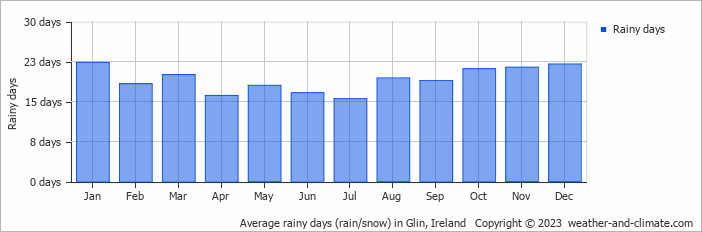
- Most rainy days are in January, February, March, April, May, June, July, August, September, October, November and December.
- On average, January is the most rainy with 22 days of rain/snow.
- On average, July is the driest month with 15 rainy days.
- The average annual number of rainy days is 229.
Current rainfall in Glin
Thu Dec 12
6°C | 2°C
E  14 km/h
14 km/hovercast and no rain
Fri Dec 13
8°C | 2°C
W 7 km/h
7 km/hbroken clouds and no rain
Sat Dec 14
10°C | 4°C
W 18 km/h
18 km/h1.1 mm
overcast and chance of slight rain