Monthly Average Rainy days in Ginzling
The number of days each month with rain, snow and hail in Ginzling (Tyrol), Austria.
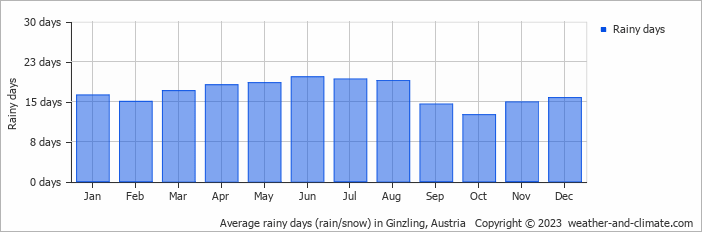
- Most rainy days are in January, February, March, April, May, June, July, August and December.
- On average, June is the most rainy with 19 days of rain/snow.
- On average, October is the driest month with 12 rainy days.
- The average annual number of rainy days is 200.
Current rainfall in Ginzling
Sun Jan 05
8°C | 0°C
S  2 m/s
2 m/s
2 m/sbroken clouds and no rain
Mon Jan 06
5°C | -1°C
S 4 m/s
4 m/sovercast and no rain
Tue Jan 07
4°C | -4°C
N 2 m/s
2 m/s22 mm
overcast and heavy snow