Monthly Average Rainy days in Gerra Verzasca
The number of days each month with rain, snow and hail in Gerra Verzasca (), Switzerland.
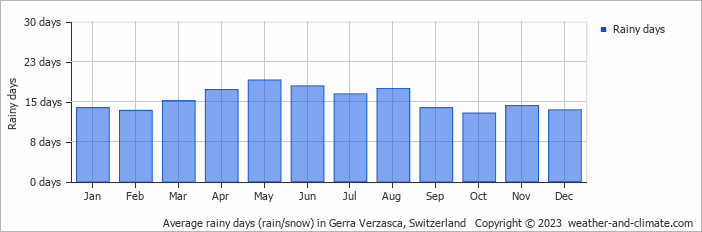
- Most rainy days are in March, April, May, June, July and August.
- On average, May is the most rainy with 19 days of rain/snow.
- On average, October is the driest month with 12 rainy days.
- The average annual number of rainy days is 184.
Current rainfall in Gerra Verzasca
Thu Dec 12
4°C | -4°C
NW  4 km/h
4 km/halmost clear and no rain
Fri Dec 13
2°C | -6°C
N 4 km/h
4 km/hpartly cloudy and no rain
Sat Dec 14
2°C | -3°C
N 4 km/h
4 km/hbroken clouds and no rain