Monthly Average Rainy days in Francisco de Orellana
The number of days each month with rain, snow and hail in Francisco de Orellana (Loreto), Peru.
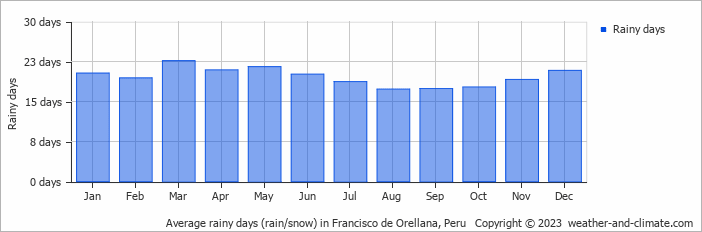
- Most rainy days are in January, February, March, April, May, June, July, August, September, October, November and December.
- On average, March is the most rainy with 22 days of rain/snow.
- On average, August is the driest month with 17 rainy days.
- The average annual number of rainy days is 235.
Current rainfall in Francisco de Orellana
Sat Nov 23
30°C | 23°C
N  4 km/h
4 km/h7.7 mm
broken clouds and thunder
Sun Nov 24
31°C | 24°C
NW 11 km/h
11 km/h11 mm
broken clouds and thunder
Mon Nov 25
30°C | 24°C
N 4 km/h
4 km/h6.7 mm
broken clouds and thunder


