Monthly Average Rainy days in Fish Creek (WI)
The number of days each month with rain, snow and hail in Fish Creek (Wisconsin), the United States of America.
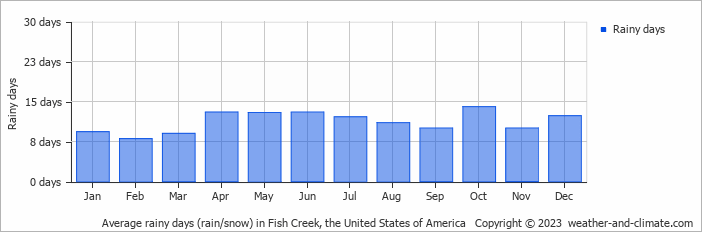
- On average, October is the most rainy with 14 days of rain/snow.
- On average, February is the driest month with 8 rainy days.
- The average annual number of rainy days is 134.
Current rainfall in Fish Creek (WI)
Mon Dec 23
1°C | -1°C
S  6 m/s
6 m/s
6 m/s5.3 mm
overcast and snow
Tue Dec 24
0°C | -3°C
N 5 m/s
5 m/sbroken clouds and no rain
Wed Dec 25
2°C | -3°C
S 4 m/s
4 m/sovercast and no rain


