Monthly Average Rainy days in Dayr al Qamar
The number of days each month with rain, snow and hail in Dayr al Qamar (Mount Lebanon), Lebanon.
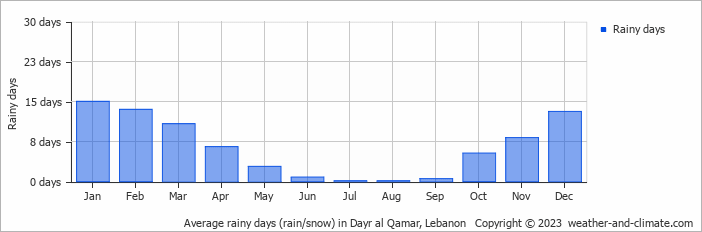
- Most rainy days are in January.
- Dayr al Qamar has dry periods in June, July, August and September.
- On average, January is the most rainy with 15 days of rain/snow.
- On average, July is the driest month with 0 rainy days.
- The average annual number of rainy days is 76.
Current rainfall in Dayr al Qamar
Tue Dec 24
16°C | 8°C
S  5 m/s
5 m/s
5 m/spartly cloudy and no rain
Wed Dec 25
18°C | 7°C
E 5 m/s
5 m/sclear and no rain
Thu Dec 26
13°C | 6°C
SW 5 m/s
5 m/s0.8 mm
partly cloudy and rain


