Monthly Average Rainy days in Corner Brook
The number of days each month with rain, snow and hail in Corner Brook (Newfoundland and Labrador), Canada.
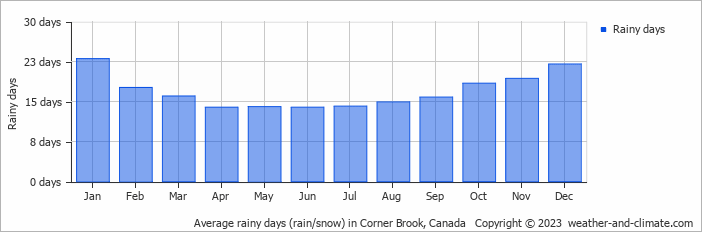
- Most rainy days are in January, February, March, September, October, November and December.
- On average, January is the most rainy with 23 days of rain/snow.
- On average, April is the driest month with 13 rainy days.
- The average annual number of rainy days is 202.
Current rainfall in Corner Brook
Wed Jan 15
-2°C | -6°C
NE  4 m/s
4 m/s
4 m/s4.8 mm
overcast and chance of snow
Thu Jan 16
-2°C | -7°C
N 2 m/s
2 m/sbroken clouds and no rain
Fri Jan 17
-2°C | -10°C
S 2 m/s
2 m/s0.9 mm
overcast and small chance of slight snow