Monthly Average Rainy days in Chŏng Chéach
The number of days each month with rain, snow and hail in Chŏng Chéach (), Cambodia.
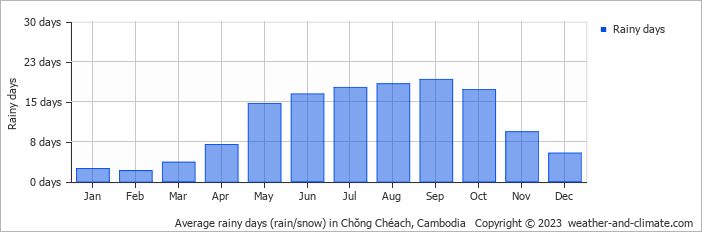
- Most rainy days are in June, July, August, September and October.
- On average, September is the most rainy with 19 days of rain/snow.
- On average, February is the driest month with 2 rainy days.
- The average annual number of rainy days is 132.
Current rainfall in Chŏng Chéach
Sun Jan 12
30°C | 20°C
NE  7 m/s
7 m/s
7 m/salmost clear and no rain
Mon Jan 13
31°C | 19°C
N 6 m/s
6 m/salmost clear and no rain
Tue Jan 14
34°C | 20°C
NE 5 m/s
5 m/sbroken clouds and no rain


