ClimateForecastMayJune >>

Average monthly rainy days in Chilecito

The number of days each month with rain, snow and hail in Chilecito (La Rioja Province), Argentina.

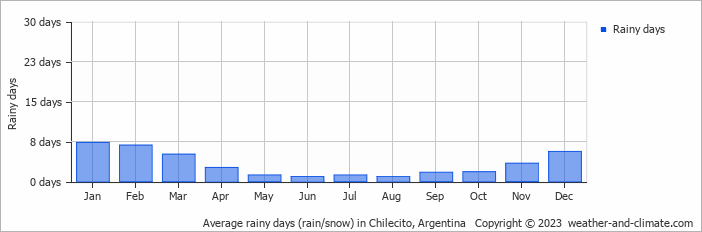
  • Chilecito has dry periods in May, June, July, August, September and October.
  • On average, January is the most rainy with 7 days of rain/snow.
  • On average, August is the driest month with 0 rainy days.
  • The average annual number of rainy days is 38.

Forecast for Chilecito

Tue   May 21
16°C | 4°C
S 18 km/h
almost clear and no rain

almost clear and no rain

Wed   May 22
14°C | 1°C
S 14 km/h
broken clouds and no rain

broken clouds and no rain

Thu   May 23
12°C | 2°C
S 11 km/h
0.4 mm
broken clouds and small chance of slight rain

broken clouds and small chance of slight rain

Interested in more climate information?

This site provides you with all the information you need about the climate in Chilecito.

Our site offers climate and forecast data for every country in the world. Are you going to Argentina? On this website you can find historical weather averages for many cities in Argentina. Not sure yet where to go? We now have a tool which recommends destinations that suit your ideal climate conditions. Find out where to go with our weather planner.