Average monthly rainy days in Chiang Khan

The number of days each month with rain, snow and hail in Chiang Khan (Loei Province), Thailand.

Average monthly rainy days in Chiang Khan,

Feel free to add this climate graph to your website. Click the copy button above.

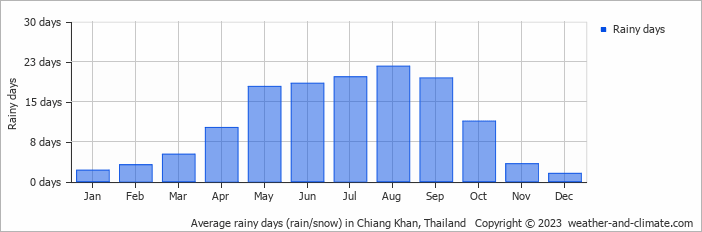
  • Most rainy days are in May, June, July, August and September.
  • On average, August is the most rainy with 21 days of rain/snow.
  • On average, December is the driest month with 1 rainy day.
  • The average annual number of rainy days is 133.

Weather Forecasts for Chiang Khan

Fri   Mar 29
36°C | 22°C
S 11 km/h
3.8 mm
partly cloudy and thunder

partly cloudy and thunder

Sat   Mar 30
37°C | 22°C
S 7 km/h
0.3 mm
partly cloudy and small chance of slight rain

partly cloudy and small chance of slight rain

Sun   Mar 31
39°C | 23°C
W 7 km/h
clear and no rain

clear and no rain

Interested in more climate information?

Weather and Climate provides you with all the information you need about the climate in Chiang Khan.

Our site offers climate and forecast data for every country in the world. Are you going to Thailand? On this website you can find historical weather averages for many cities in Thailand. Not sure yet where to go? We now have a tool which recommends destinations that suit your ideal climate conditions. Find out where to go with our weather planner.