Monthly Average Rainy days in Chiang Kham
The number of days each month with rain, snow and hail in Chiang Kham (Phayao Province), Thailand.
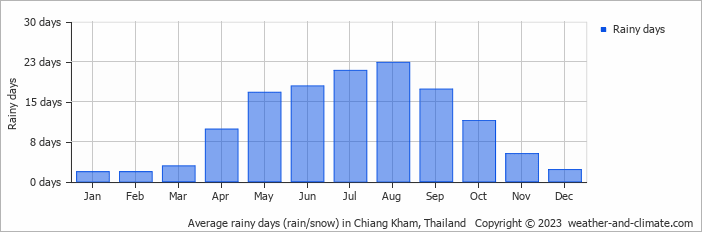
- Most rainy days are in May, June, July, August and September.
- Chiang Kham has dry periods in January and February.
- On average, August is the most rainy with 22 days of rain/snow.
- On average, January is the driest month with 1 rainy day.
- The average annual number of rainy days is 130.
Current rainfall in Chiang Kham
Wed Jan 15
27°C | 10°C
NE  3 m/s
3 m/s
3 m/sclear and no rain
Thu Jan 16
27°C | 11°C
N 2 m/s
2 m/sclear and no rain
Fri Jan 17
27°C | 11°C
NW 1 m/s
1 m/sclear and no rain


