Average monthly rainy days in Chapala
The number of days each month with rain, snow and hail in Chapala (Jalisco), Mexico.
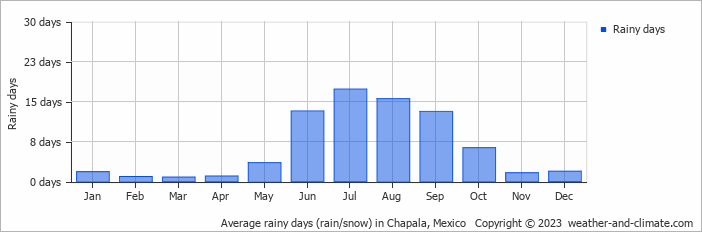
- Most rainy days are in July and August.
- Chapala has dry periods in January, February, March, April, November and December.
- On average, July is the most rainy with 17 days of rain/snow.
- On average, March is the driest month with 0 rainy days.
- The average annual number of rainy days is 76.
Weather Forecasts for Chapala
Fri May 03
33°C | 17°C
SW  14 km/h
14 km/hclear and no rain
Sat May 04
33°C | 18°C
S 25 km/h
25 km/halmost clear and no rain
Sun May 05
33°C | 18°C
S 14 km/h
14 km/hpartly cloudy and no rain


