Monthly Average Rainy days in Champotón
The number of days each month with rain, snow and hail in Champotón (Campeche), Mexico.
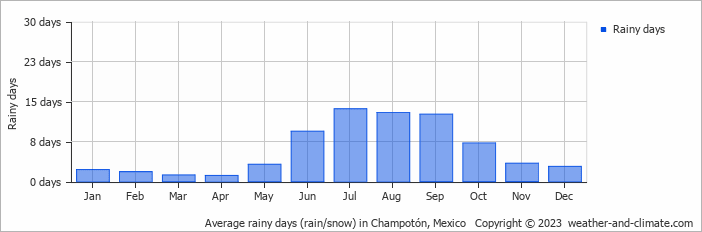
- Champotón has dry periods in February, March and April.
- On average, July is the most rainy with 13 days of rain/snow.
- On average, April is the driest month with 1 rainy day.
- The average annual number of rainy days is 71.
Current rainfall in Champotón
Sun Jan 12
32°C | 21°C
SE  4 m/s
4 m/s
4 m/salmost clear and no rain
Mon Jan 13
31°C | 22°C
NW 5 m/s
5 m/s0.7 mm
partly cloudy and chance of slight rain
Tue Jan 14
31°C | 22°C
E 3 m/s
3 m/s2.8 mm
partly cloudy and rain


