ClimateForecastMayJune >>

Average monthly rainy days in Chaling

The number of days each month with rain, snow and hail in Chaling (), China.

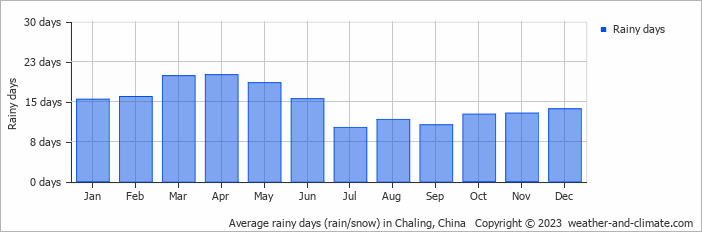
  • Most rainy days are in January, February, March, April, May and June.
  • On average, April is the most rainy with 20 days of rain/snow.
  • On average, July is the driest month with 10 rainy days.
  • The average annual number of rainy days is 176.

Forecast for Chaling

Thu   May 09
23°C | 18°C
NE 7 km/h
1.1 mm
broken clouds and no rain

broken clouds and no rain

Fri   May 10
23°C | 16°C
NE 11 km/h
4.9 mm
broken clouds and rain

broken clouds and rain

Sat   May 11
24°C | 19°C
SW 14 km/h
55 mm
broken clouds and thunder

broken clouds and thunder

Interested in more climate information?

This site provides you with all the information you need about the climate in Chaling.

Our site offers climate and forecast data for every country in the world. Are you going to China? On this website you can find historical weather averages for many cities in China. Not sure yet where to go? We now have a tool which recommends destinations that suit your ideal climate conditions. Find out where to go with our weather planner.