ClimateForecastMayJune >>

Average monthly rainy days in Čatrnja

The number of days each month with rain, snow and hail in Čatrnja (), Croatia.

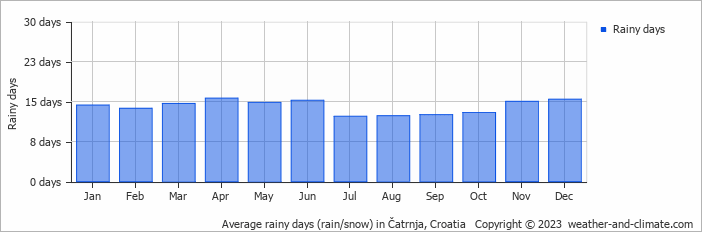
  • Most rainy days are in April, June, November and December.
  • On average, April is the most rainy with 15 days of rain/snow.
  • On average, July is the driest month with 12 rainy days.
  • The average annual number of rainy days is 168.

Weather Forecasts for Čatrnja

Fri   May 03
18°C | 9°C
NW 11 km/h
3.3 mm
overcast and  chance of slight rain

overcast and chance of slight rain

Sat   May 04
19°C | 9°C
N 11 km/h
8.4 mm
broken clouds and  chance of rain

broken clouds and chance of rain

Sun   May 05
23°C | 7°C
W 7 km/h
0.2 mm
partly cloudy and small chance of slight rain

partly cloudy and small chance of slight rain

Interested in more climate information?

Weather and Climate provides you with all the information you need about the climate in Čatrnja.

Our site offers climate and forecast data for every country in the world. Are you going to Croatia? On this website you can find historical weather averages for many cities in Croatia. Not sure yet where to go? We now have a tool which recommends destinations that suit your ideal climate conditions. Find out where to go with our weather planner.