Monthly Average Rainy days in Cascade Locks (OR)
The number of days each month with rain, snow and hail in Cascade Locks (Oregon), the United States of America.
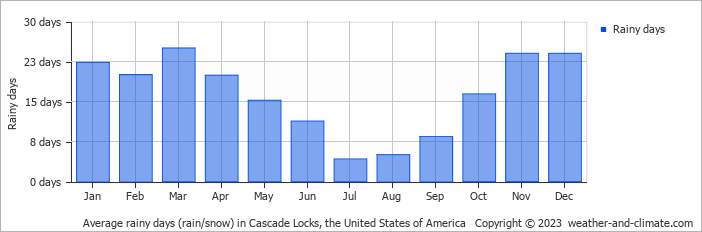
- Most rainy days are in January, February, March, April, May, October, November and December.
- On average, March is the most rainy with 25 days of rain/snow.
- On average, July is the driest month with 4 rainy days.
- The average annual number of rainy days is 195.
Current rainfall in Cascade Locks (OR)
Sun Dec 22
10°C | 5°C
E  2 m/s
2 m/s
2 m/s22 mm
overcast and heavy rain
Mon Dec 23
11°C | 8°C
E 4 m/s
4 m/s11 mm
broken clouds and chance of rain
Tue Dec 24
11°C | 8°C
W 3 m/s
3 m/s6.7 mm
broken clouds and rain


