Monthly Average Rainy days in Cachora
The number of days each month with rain, snow and hail in Cachora (Apurimac), Peru.
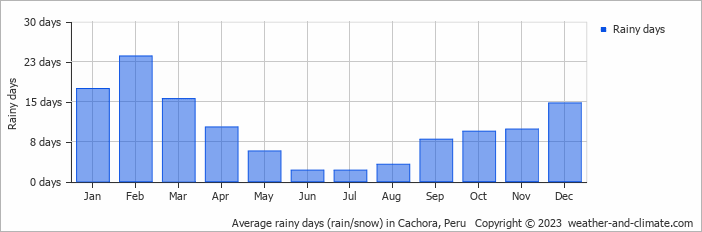
- Most rainy days are in January, February and March.
- On average, February is the most rainy with 23 days of rain/snow.
- On average, July is the driest month with 2 rainy days.
- The average annual number of rainy days is 121.
Current rainfall in Cachora
Sun Jan 05
21°C | 8°C
NW  2 m/s
2 m/s
2 m/s1.2 mm
broken clouds and slight rain
Mon Jan 06
20°C | 10°C
NW 2 m/s
2 m/s1.3 mm
broken clouds and rain
Tue Jan 07
22°C | 9°C
NW 2 m/s
2 m/s3.2 mm
broken clouds and thunder


