Average Rainy - Precipitation days in Bystra
With 182 days and 1153 mm of annual rain/snow, Bystra has a moderate precipitation pattern. On this page, you can learn everything about the number of precipitation days.
Monthly Distribution of Rainy Days
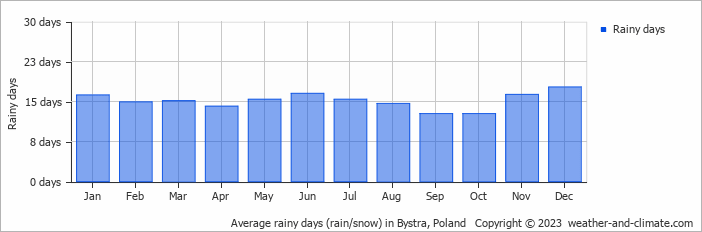
Precipitation peaks in July with 146 mm falling over 15 rainy days. The driest period is December, receiving 71 mm across 18 snowy/rainy days.
Amsterdam Precipitation Days Compared World Wide
On average, Bystra receives over 182 days of precipitation annually. For comparison, here is some data from popular tourist destinations around the world:Las Vegas, USA, gets about 26 precipitation days annually, which is typical for its arid desert climate.
In Kuala Lumpur, Malaysia, the city experiences around 212 precipitation days annually, consistent with its tropical rainforest climate.
The city of Rome, Italy, averages 131 precipitation days annually, spread fairly evenly throughout the year.
The climate in San Francisco, USA, sees around 70 precipitation days annually, mostly during the winter months.
Buenos AiresBuenos Aires, Argentina, has around 92 precipitation days annually, mostly during the summer months.
Perth, Australia, sees approximately 103 precipitation days annually, mostly during the winter months.
Rain Facts From Around the Globe
Let’s explore more fascinating precipitation records:
- Tutunendo, Colombia, gets about 340 days of rain every year, which arguably makes it the wettest place in the world.
- On Réunion Island, a tropical cyclone generated 1825 mm in just 24 hours.
- Singapore receives thunder on 167 days in the year and is considered one of the most thunderous cities in the world.
- The smallest drops that fall are called drizzle drops, and they have a diameter of 0.5 mm.
- Some heavy storms generate "diamond dust," which consists of very small ice crystals that float in the air.
For more detailed information about rainfall patterns in Bystra, visit our Rainfall & Precipitation page.


