Monthly Average Rainy days in Bundaberg
The number of days each month with rain, snow and hail in Bundaberg (Queensland), Australia.
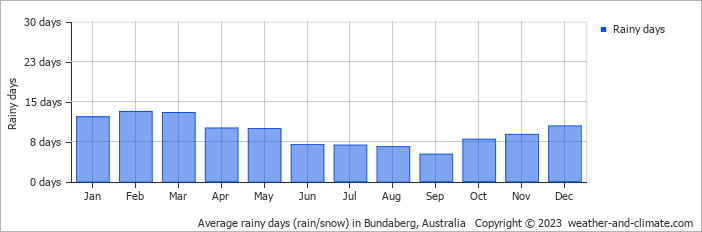
- On average, February is the most rainy with 13 days of rain/snow.
- On average, September is the driest month with 5 rainy days.
- The average annual number of rainy days is 110.
Current rainfall in Bundaberg
Fri Nov 22
28°C | 19°C
SE  25 km/h
25 km/h8.2 mm
broken clouds and rain
Sat Nov 23
27°C | 18°C
SE 29 km/h
29 km/h0.3 mm
partly cloudy and small chance of slight rain
Sun Nov 24
28°C | 18°C
E 29 km/h
29 km/h0.4 mm
partly cloudy and slight rain


