Average monthly rainy days in Bumbang
The number of days each month with rain, snow and hail in Bumbang (Lombok), Indonesia.
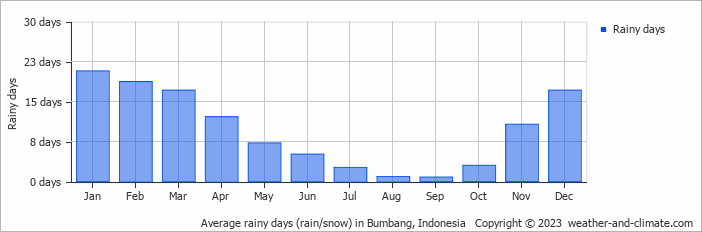
- Most rainy days are in January, February, March and December.
- Bumbang has dry periods in August and September.
- On average, January is the most rainy with 20 days of rain/snow.
- On average, September is the driest month with 0 rainy days.
- The average annual number of rainy days is 115.
Weather Forecasts for Bumbang
Mon Apr 29
32°C | 27°C
SE  25 km/h
25 km/hpartly cloudy and no rain
Tue Apr 30
32°C | 27°C
SE 25 km/h
25 km/h0.4 mm
broken clouds and chance of slight rain
Wed May 01
32°C | 27°C
SE 25 km/h
25 km/h0.1 mm
partly cloudy and slight rain