ClimateForecastMayJune >>

Average monthly rainy days in Bridgeport (WV)

The number of days each month with rain, snow and hail in Bridgeport (West Virginia), the United States of America.

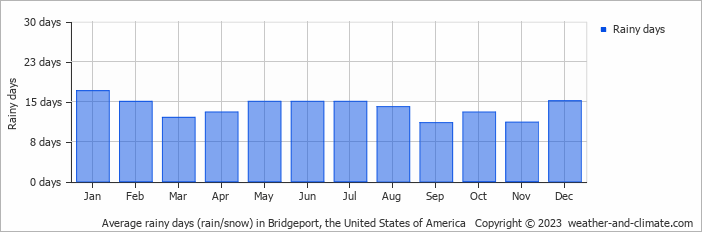
  • Most rainy days are in January, February, May, June, July and December.
  • On average, January is the most rainy with 17 days of rain/snow.
  • On average, September is the driest month with 11 rainy days.
  • The average annual number of rainy days is 166.

Forecast for Bridgeport (WV)

Sun   May 05
25°C | 15°C
SW 11 km/h
5 mm
partly cloudy and thunder

partly cloudy and thunder

Mon   May 06
25°C | 15°C
NW 7 km/h
1 mm
broken clouds and rain

broken clouds and rain

Tue   May 07
26°C | 16°C
SW 14 km/h
7.8 mm
broken clouds and thunder

broken clouds and thunder

Interested in more climate information?

This site provides you with all the information you need about the climate in Bridgeport.

Our site offers climate and forecast data for every country in the world. Are you going to the United States of America? On this website you can find historical weather averages for many cities in the United States of America. Not sure yet where to go? We now have a tool which recommends destinations that suit your ideal climate conditions. Find out where to go with our weather planner.