ClimateForecastAprilMay >>

Average monthly rainy days in Braşov

The number of days each month with rain, snow and hail in Braşov (Brasov), Romania.

Average monthly rainy days in Braşov,

Feel free to add this climate graph to your website. Click the copy button above.

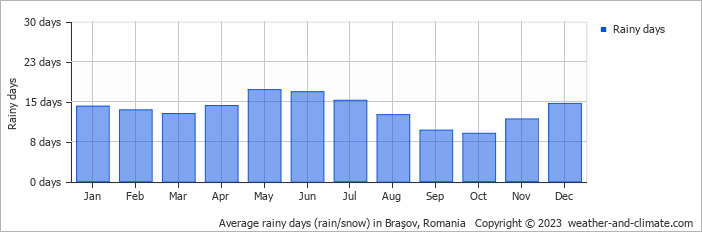
  • Most rainy days are in May, June and July.
  • On average, May is the most rainy with 17 days of rain/snow.
  • On average, October is the driest month with 9 rainy days.
  • The average annual number of rainy days is 161.

Weather Forecasts for Braşov

Thu   Apr 18
8°C | 3°C
W 22 km/h
8 mm
overcast and rain

overcast and rain

Fri   Apr 19
11°C | 2°C
W 18 km/h
1.9 mm
partly cloudy and  chance of slight rain

partly cloudy and chance of slight rain

Sat   Apr 20
13°C | 0°C
N 14 km/h
0.5 mm
broken clouds and  chance of slight rain

broken clouds and chance of slight rain

Interested in more climate information?

Weather and Climate provides you with all the information you need about the climate in Braşov.

Our site offers climate and forecast data for every country in the world. Are you going to Romania? On this website you can find historical weather averages for many cities in Romania. Not sure yet where to go? We now have a tool which recommends destinations that suit your ideal climate conditions. Find out where to go with our weather planner.