Monthly Average Rainy days in Brading
The number of days each month with rain, snow and hail in Brading (Isle of Wight), the United Kingdom.
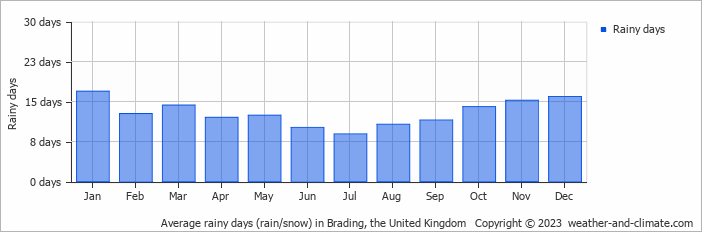
- Most rainy days are in January, November and December.
- On average, January is the most rainy with 16 days of rain/snow.
- On average, July is the driest month with 8 rainy days.
- The average annual number of rainy days is 154.
Current rainfall in Brading
Sun Dec 15
12°C | 7°C
W  29 km/h
29 km/hbroken clouds and no rain
Mon Dec 16
12°C | 9°C
SW 29 km/h
29 km/hovercast and no rain
Tue Dec 17
13°C | 8°C
S 32 km/h
32 km/hovercast and no rain


