Monthly Average Rainy days in Bolivar Beach
The number of days each month with rain, snow and hail in Bolivar Beach (), the United States of America.
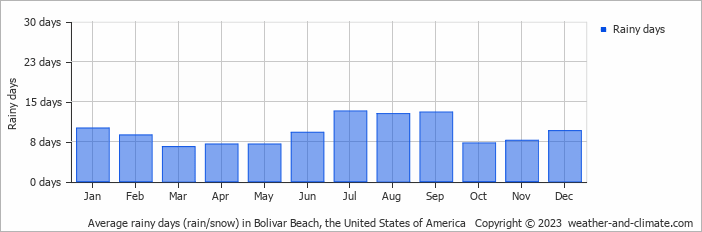
- On average, July is the most rainy with 13 days of rain/snow.
- On average, March is the driest month with 6 rainy days.
- The average annual number of rainy days is 111.
Current rainfall in Bolivar Beach
Tue Nov 26
18°C | 11°C
N  22 km/h
22 km/halmost clear and no rain
Wed Nov 27
26°C | 17°C
SW 32 km/h
32 km/h0.3 mm
partly cloudy and small chance of slight rain
Thu Nov 28
22°C | 11°C
N 36 km/h
36 km/hbroken clouds and no rain


