Monthly Average Rainy days in Boca Barranca
The number of days each month with rain, snow and hail in Boca Barranca (), Costa Rica.
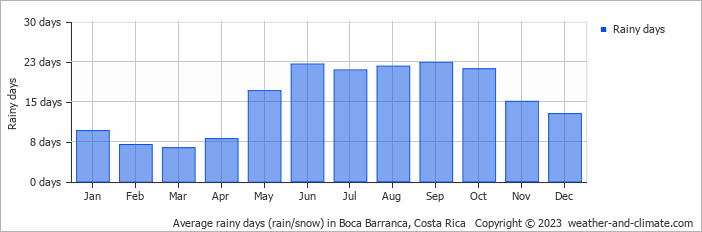
- Most rainy days are in May, June, July, August, September, October and November.
- On average, September is the most rainy with 22 days of rain/snow.
- On average, March is the driest month with 6 rainy days.
- The average annual number of rainy days is 183.
Current rainfall in Boca Barranca
Tue Nov 26
30°C | 24°C
S  14 km/h
14 km/h0.9 mm
broken clouds and thunder
Wed Nov 27
29°C | 24°C
S 11 km/h
11 km/h13 mm
broken clouds and thunder
Thu Nov 28
29°C | 24°C
S 11 km/h
11 km/h12 mm
broken clouds and thunder