Monthly Average Rainy days in Birch Run (MI)
The number of days each month with rain, snow and hail in Birch Run (Michigan), the United States of America.
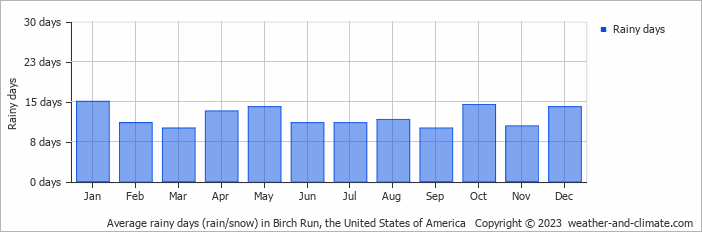
- Most rainy days are in January.
- On average, January is the most rainy with 15 days of rain/snow.
- On average, September is the driest month with 10 rainy days.
- The average annual number of rainy days is 145.
Current rainfall in Birch Run (MI)
Sun Dec 15
3°C | 0°C
SE  22 km/h
22 km/h11 mm
overcast and rain
Mon Dec 16
8°C | 2°C
S 22 km/h
22 km/h7.7 mm
overcast and heavy rain
Tue Dec 17
4°C | -1°C
W 25 km/h
25 km/hbroken clouds and no rain


