Monthly Average Rainy days in Barwon Heads
The number of days each month with rain, snow and hail in Barwon Heads (Victoria), Australia.
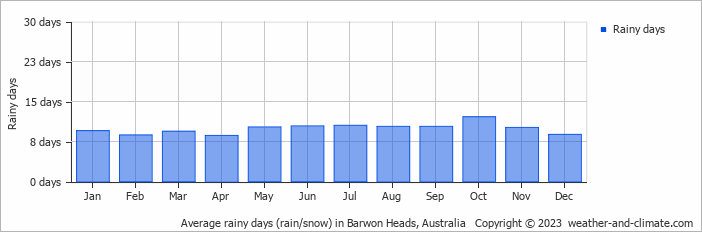
- On average, October is the most rainy with 12 days of rain/snow.
- On average, April is the driest month with 8 rainy days.
- The average annual number of rainy days is 118.
Current rainfall in Barwon Heads
Wed Jan 29
20°C | 14°C
S  6 m/s
6 m/s
6 m/sbroken clouds and no rain
Thu Jan 30
21°C | 14°C
S 6 m/s
6 m/s0.2 mm
broken clouds and small chance of slight rain
Fri Jan 31
23°C | 16°C
S 5 m/s
5 m/spartly cloudy and no rain


