Monthly Average Rainy days in Barra Vieja
The number of days each month with rain, snow and hail in Barra Vieja (Guerrero), Mexico.
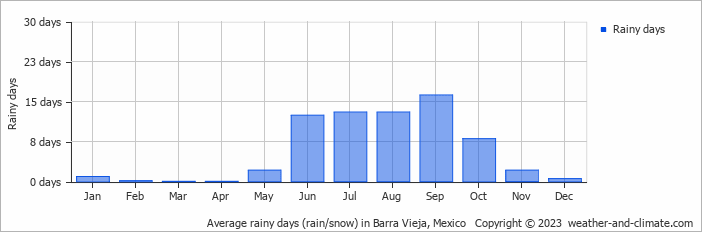
- Most rainy days are in September.
- Barra Vieja has dry periods in January, February, March, April and December.
- On average, September is the most rainy with 16 days of rain/snow.
- On average, March is the driest month with 0 rainy days.
- The average annual number of rainy days is 68.
Current rainfall in Barra Vieja
Mon Dec 23
32°C | 22°C
W  5 m/s
5 m/s
5 m/s3.8 mm
partly cloudy and small chance of rain
Tue Dec 24
32°C | 22°C
W 5 m/s
5 m/s12 mm
broken clouds and chance of rain
Wed Dec 25
32°C | 21°C
W 4 m/s
4 m/sbroken clouds and no rain


