ClimateForecastMayJune >>

Average monthly rainy days in Ban Wat Luang

The number of days each month with rain, snow and hail in Ban Wat Luang (Nong Khai Province), Thailand.

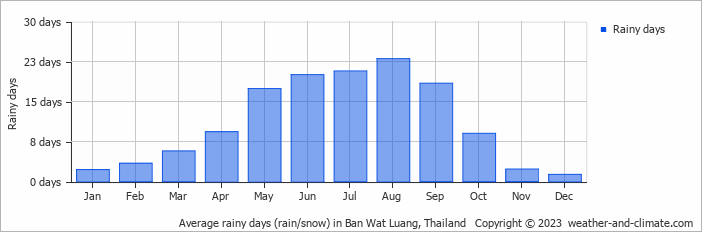
  • Most rainy days are in May, June, July, August and September.
  • On average, August is the most rainy with 23 days of rain/snow.
  • On average, December is the driest month with 1 rainy day.
  • The average annual number of rainy days is 132.

Forecast for Ban Wat Luang

Sun   May 05
38°C | 25°C
E 11 km/h
1.7 mm
almost clear and slight rain

almost clear and slight rain

Mon   May 06
35°C | 24°C
E 14 km/h
2.6 mm
almost clear and  chance of slight rain

almost clear and chance of slight rain

Tue   May 07
36°C | 24°C
E 11 km/h
12 mm
partly cloudy and thunder

partly cloudy and thunder

Interested in more climate information?

This site provides you with all the information you need about the climate in Ban Wat Luang.

Our site offers climate and forecast data for every country in the world. Are you going to Thailand? On this website you can find historical weather averages for many cities in Thailand. Not sure yet where to go? We now have a tool which recommends destinations that suit your ideal climate conditions. Find out where to go with our weather planner.