Monthly Average Rainy days in Ban Thalat Choeng Thale
The number of days each month with rain, snow and hail in Ban Thalat Choeng Thale (), Thailand.
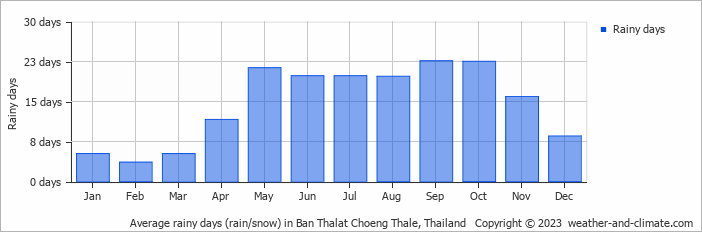
- Most rainy days are in May, June, July, August, September, October and November.
- On average, September is the most rainy with 22 days of rain/snow.
- On average, February is the driest month with 3 rainy days.
- The average annual number of rainy days is 175.
Current rainfall in Ban Thalat Choeng Thale
Sat Dec 14
29°C | 24°C
NW  11 km/h
11 km/h30 mm
broken clouds and rain
Sun Dec 15
31°C | 25°C
E 18 km/h
18 km/h7.3 mm
broken clouds and thunder
Mon Dec 16
30°C | 24°C
NE 22 km/h
22 km/h6.6 mm
broken clouds and thunder


