Monthly Average Rainy days in Ban Tha Mai Ruak
The number of days each month with rain, snow and hail in Ban Tha Mai Ruak (Petchaburi Province), Thailand.
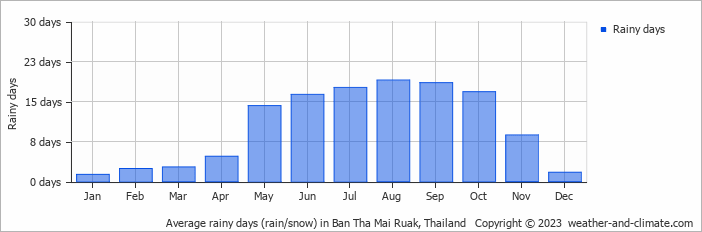
- Most rainy days are in June, July, August, September and October.
- Ban Tha Mai Ruak has dry periods in January and December.
- On average, August is the most rainy with 19 days of rain/snow.
- On average, January is the driest month with 1 rainy day.
- The average annual number of rainy days is 123.
Current rainfall in Ban Tha Mai Ruak
Sun Dec 15
30°C | 23°C
NE  22 km/h
22 km/hbroken clouds and no rain
Mon Dec 16
30°C | 21°C
NE 18 km/h
18 km/hpartly cloudy and no rain
Tue Dec 17
32°C | 20°C
N 18 km/h
18 km/halmost clear and no rain


