Average Rainy - Precipitation days in Ban Patong
Ban Patong sees 174 days of precipitation annually, totaling to 2177 mm of rain. Learn more about it on this page.
Monthly Distribution of Rainy Days
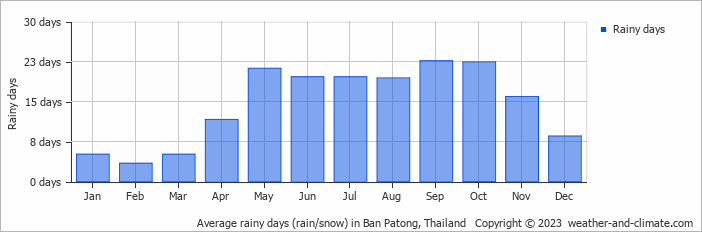
Precipitation peaks in October with 306 mm falling over 22 rainy days. The driest period is February, receiving 31 mm across 3 rainy days.
Amsterdam Precipitation Days Compared World Wide
On average, Ban Patong receives over 174 days of precipitation annually. For comparison, here is some data from popular tourist destinations around the world:In Cairo, Egypt, there are only about 16 precipitation days annually, making it one of the driest capitals in the world.
In Kuala Lumpur, Malaysia, the city experiences around 212 precipitation days annually, consistent with its tropical rainforest climate.
In Barcelona, Spain, there are approximately 121 precipitation days per year, evenly distributed across the year with no extreme wet or dry seasons.
Boston, USA, experiences 134 precipitation days annually, including significant snow during winter.
Beijing, China, averages 72 precipitation days annually, concentrated in the summer months.
In Brisbane, Australia, the city averages 123 precipitation days per year, making it wetter than Sydney.
Rain Facts From Around the Globe
Let’s explore more fascinating precipitation records:
- Tutunendo, Colombia, gets about 340 days of rain every year, which arguably makes it the wettest place in the world.
- On RĂ©union Island, a tropical cyclone generated 1825 mm in just 24 hours.
- Singapore receives thunder on 167 days in the year and is considered one of the most thunderous cities in the world.
- The smallest drops that fall are called drizzle drops, and they have a diameter of 0.5 mm.
- Some heavy storms generate "diamond dust," which consists of very small ice crystals that float in the air.
For more detailed information about rainfall patterns in Ban Patong, visit our Rainfall & Precipitation page.
Current rainfall in Ban Patong


