Monthly Average Rainy days in Ban Chao Mai
The number of days each month with rain, snow and hail in Ban Chao Mai (Trang Province), Thailand.
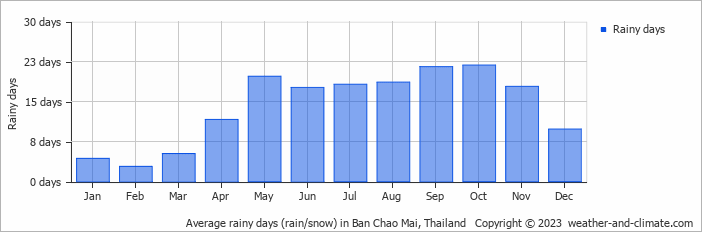
- Most rainy days are in May, June, July, August, September, October and November.
- On average, October is the most rainy with 21 days of rain/snow.
- On average, February is the driest month with 2 rainy days.
- The average annual number of rainy days is 168.
Current rainfall in Ban Chao Mai
Sat Dec 14
28°C | 23°C
NE  7 km/h
7 km/h30 mm
broken clouds and thunder
Sun Dec 15
30°C | 24°C
NE 18 km/h
18 km/h6.9 mm
broken clouds and thunder
Mon Dec 16
29°C | 24°C
NE 14 km/h
14 km/h9.3 mm
broken clouds and thunder


