Monthly Average Rainy days in Ban Bang Niang
The number of days each month with rain, snow and hail in Ban Bang Niang (Phang Nga Province), Thailand.
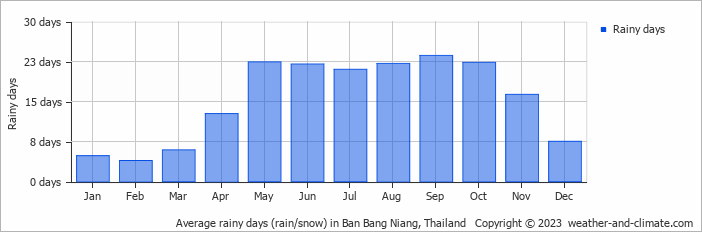
- Most rainy days are in May, June, July, August, September, October and November.
- On average, September is the most rainy with 23 days of rain/snow.
- On average, February is the driest month with 3 rainy days.
- The average annual number of rainy days is 184.
Current rainfall in Ban Bang Niang
Mon Jan 06
33°C | 23°C
E  3 m/s
3 m/s
3 m/s19 mm
broken clouds and small chance of rain
Tue Jan 07
33°C | 23°C
NW 2 m/s
2 m/s4.5 mm
partly cloudy and small chance of rain
Wed Jan 08
33°C | 22°C
W 2 m/s
2 m/s0.8 mm
partly cloudy and small chance of rain


