Monthly Average Rainy days in Ban Bang Muang
The number of days each month with rain, snow and hail in Ban Bang Muang (Nonthaburi Province), Thailand.
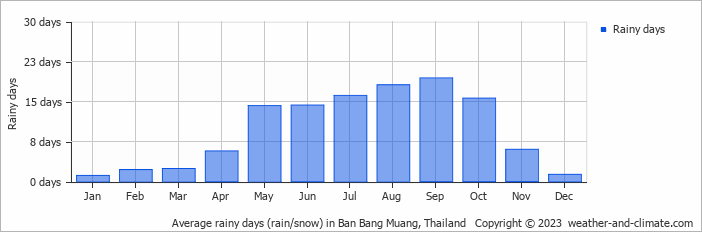
- Most rainy days are in July, August, September and October.
- Ban Bang Muang has dry periods in January and December.
- On average, September is the most rainy with 19 days of rain/snow.
- On average, January is the driest month with 1 rainy day.
- The average annual number of rainy days is 116.
Current rainfall in Ban Bang Muang
Wed Dec 04
35°C | 24°C
N  7 km/h
7 km/halmost clear and no rain
Thu Dec 05
33°C | 24°C
NW 4 km/h
4 km/hpartly cloudy and no rain
Fri Dec 06
34°C | 24°C
N 7 km/h
7 km/hbroken clouds and no rain


